Climate Scenarios for South Asia and Indian Monsoon
The CCCR at IITM focus on the development of new climate modelling capabilities in India and South Asia to address issues concerning the science of climate change.
CCCR-IITM has generated an ensemble of high resolution dynamically downscaled future projections of regional climate over South Asia and Indian monsoon, which will be useful for impact assessment studies and for quantifying uncertainties in the regional projections. A brief overview of this core climate change modeling activity of CCCR-IITM was presented in an Interim Report on Climate Change over India .
The results of further detailed analysis of these regional climate projections are presented here as maps and time series, with selected data available for download.
| Region | Scenario | Period | Climate Indices |
| |
|

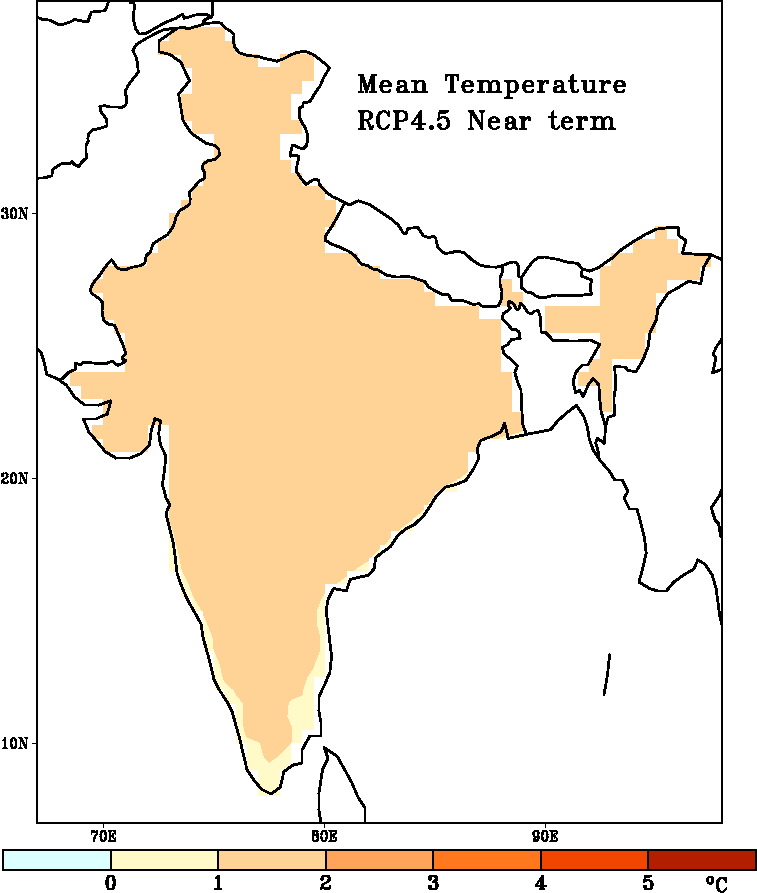
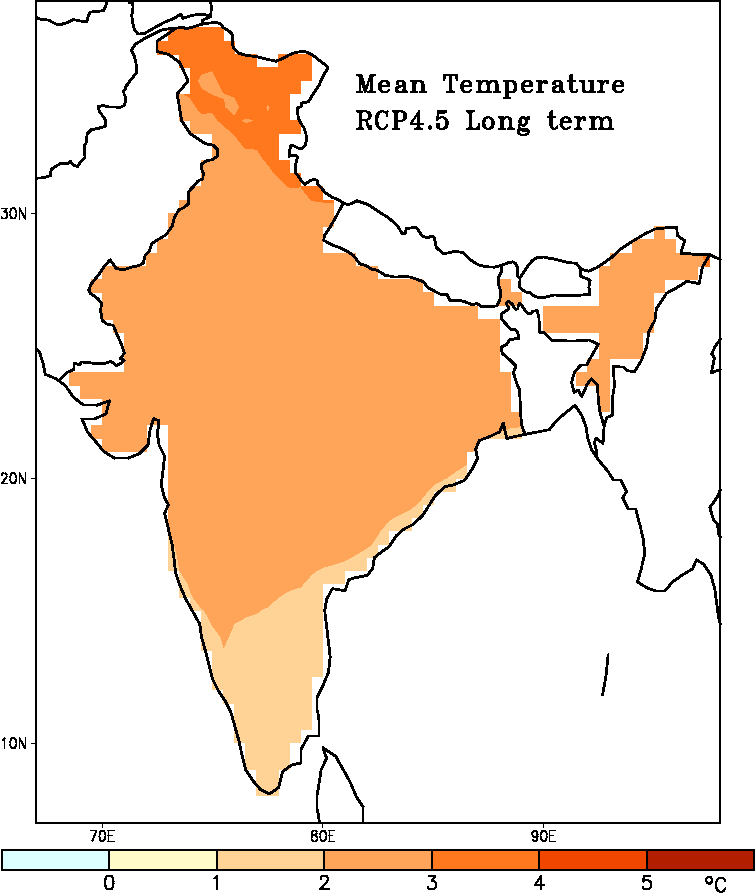
The spatial pattern of the change in annual temperature for the period 2065-2095 compared with 1976-2005 based on an ensemble with six regional climate projections for the RCP4.5 scenario. The maps below show more information about the spread among ensemble members, as well as for other time periods.

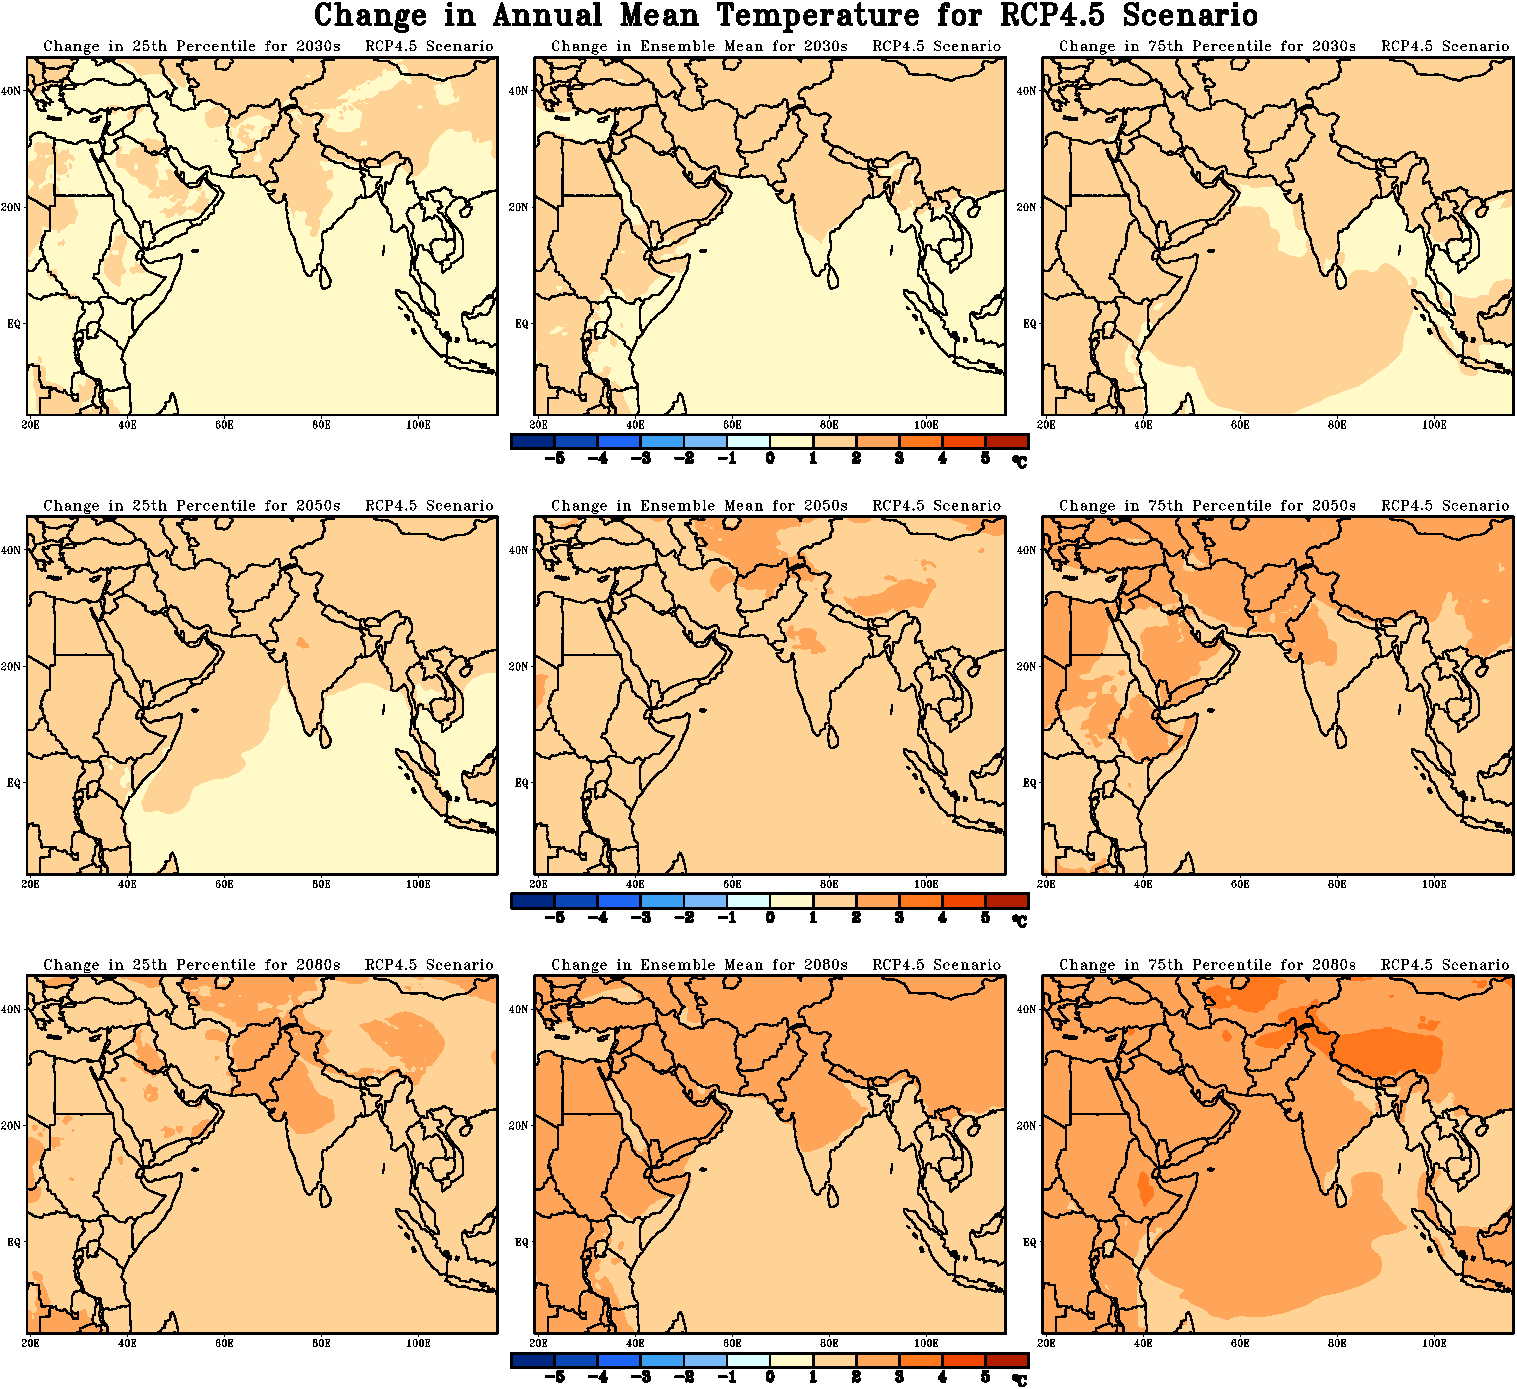
The spatial pattern of the change in annual temperature for the period (top row) 2021-2045, (center row) 2035-2065, and (bottom row) 2065-2095 compared with 1976-2005. The change in the (left column) 25th percentile, (middle column) ensemble mean, and (right column) 75th percentile are shown based on an ensemble with six regional climate projections for the RCP4.5 scenario.
| |||
|
Calculated change in annual mean temperature (°C) compared to 1971-2000 at the period for 1.5°C global warming according to scenario RCP8.5 (read more).
The map is based on an average of nine climate scenarios at a global warming of 1.5°C compared to the period 1881-1910. Below is more information about the climate scenarios used as well as maps for other time periods.
| Calculated change in annual mean temperature (°C) compared to 1971-2000 at the period for 1.5°C global warming according to scenario RCP8.5 (read more).
The map is based on an average of nine climate scenarios at a global warming of 1.5°C compared to the period 1881-1910. Below is more information about the climate scenarios used as well as maps for other time periods.
|
 |
Top left: Ensemble mean (°C) for the control period 1971-2000. The average of the annual mean temperature during the control period 1971-2000 for the nine climate scenarios in the ensemble.
Top right: Change in ensemble mean (°C) for the period 2071-2100 compared with 1971-2000. This is the same map as the one at the top of the page.
Bottom left: Standard deviation (°C) for members of the ensemble for the period 2071-2100. The standard deviation is a measure of the spread of the nine climate scenarios in the ensemble. If the values of all nine members lie close to the mean, then the standard deviation is low, but if the values are spread far above and below the mean then the standard deviation is high.
Bottom right: Number of climate scenarios in the ensemble that show an increase for the period 2071-2100 compared to the control period 1971-2000. If all nine members of the ensemble show an increase for the future scenario for a grid square, then a certain amount of robustness/certainty can be assumed for the result there. The same applies if all nine members indicate a decrease. However, if for example four members show an increase and the other five show a decrease, this means that the members disagree and the result is uncertain.
Calculated change in annual mean temperature (°C) compared to 1971-2000 at the period for 1.5°C global warming according to scenario RCP8.5 (read more).
The map is based on an average of nine climate scenarios at a global warming of 1.5°C compared to the period 1881-1910. Below is more information about the climate scenarios used as well as maps for other time periods.
| Calculated change in annual mean temperature (°C) compared to 1971-2000 at the period for 1.5°C global warming according to scenario RCP8.5 (read more).
The map is based on an average of nine climate scenarios at a global warming of 1.5°C compared to the period 1881-1910. Below is more information about the climate scenarios used as well as maps for other time periods.
|


